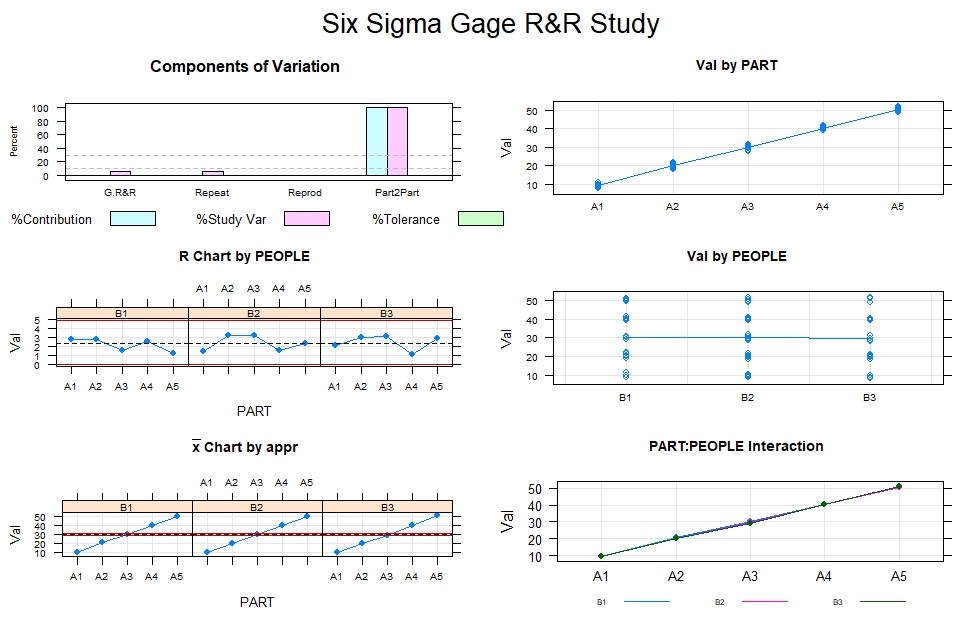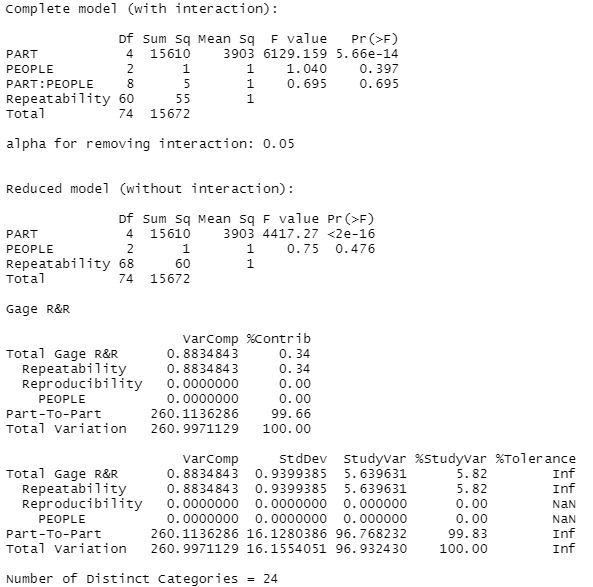

Gage R and R is used to analyze the level of measurement system.
First row is the names of columns because names are used in the analysis.
First column is the meadured data (numerical data). Second column is the factor for parts (categorical data). Third column is the factor for appraisers (operators, machines, ...) (categorical data).
LSL <- 0 # Used to calculate %Tolerance
USL <- 0 # Used to calculate %Tolerance
setwd("C:/Rtest") # Set the directory of data file
Data <- read.csv("Data.csv", header=T) # Read data
library(SixSigma)
name1 <- colnames(Data[1])
name2 <- colnames(Data[2])
name3 <- colnames(Data[3])
ss.rr(name1,name2,name3,lsl=LSL,usl=USL,data=Data)


Result of '%GRR' is '%StudyVar' in '$studyVar'. Result of 'ndc' in 'ncat'. 'ncat' is 'number of distinct categories'.
